Here’s a violin playing the note G (with frequency 784 Hz), followed by a flute playing the same note:
In part 1 of this series on what makes a musical sound, we looked at two basic properties of a musical note – its pitch and loudness. Since these two notes are at the same pitch, and are roughly equally loud, how come they sound so different? How can we tell, when listening to a song, what instrument is playing a particular melodic line? The answer lies in the tone quality, or timbre, of a musical sound – a quality that varies based on which instrument is playing, and even on how the instrument is played.
Timbre is a subjective quality that can be difficult to describe – for instance, we might say that a violin sounds brighter than a flute, or that Bonnie Tyler’s voice has a rough quality. There are, however, some objective properties of a sound that affect its timbre, and in parts 2 and 3 of this series I’ll break these down – in particular, we’ll look at the spectrum and envelope of the sound.
Spectrum and Harmonics
The spectrum of a sound shows which frequencies are present in the sound, and how much of each frequency is present. Here are the spectra of the above violin and flute notes:
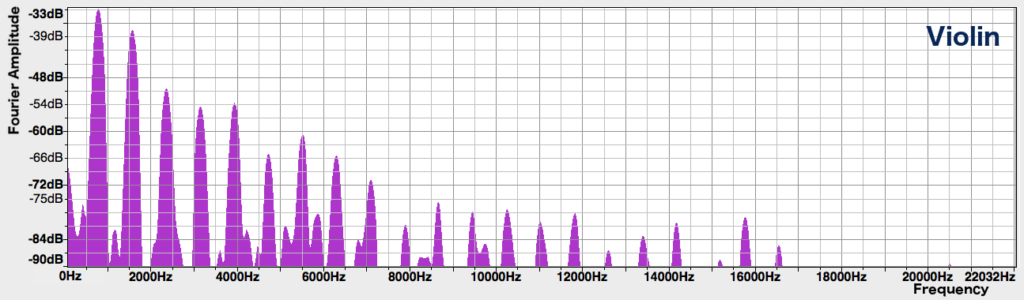
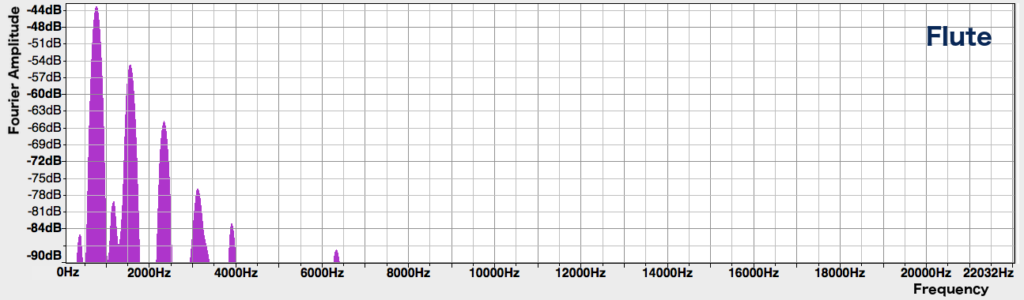
In both spectra, the leftmost and highest peak has a frequency of about 784 Hz, corresponding to the note G5 that we hear. This is followed by a series of peaks to the right, spaced at equal frequency intervals, of roughly decreasing heights. However, the flute only has about 5 peaks in total, while the violin has many more.
But wait a minute – aren’t the sounds in question each a single note, played by a single instrument? How come there are multiple frequencies visible in their spectra? In fact, most sounds generated by musical instruments don’t only consist of a single frequency, but are a mixture of many different frequencies which are integer multiples of the lowest frequency. The lowest frequency is called the fundamental frequency, and the higher frequencies are called harmonics. While we hear a note with a pitch corresponding to the fundamental frequency, it is the harmonics that give the note its texture and colour.
The strength of each harmonic is an important aspect that allows us to differentiate between instruments. In general, harmonics in the high frequencies give a sound a brighter quality, but if they are too strong, the note can sound harsh. The many high harmonics in the violin’s spectrum give it a piercing quality that allows it to cut through and be heard above an orchestra. For the flute, meanwhile, only the lower few harmonics are prominent, giving it a purer, more mellow tone.
To learn more about the spectrum and how it is obtained, check out this post.
Click to Expand: Missing FundamentalsThe brain can do some pretty complicated calculations when interpreting musical sounds. Given all the harmonics present in a note, how do you suppose the brain figures out what the fundamental frequency is, and what pitch to assign the sound? Does it simply take the lowest frequency?
It turns out that things aren’t that simple. Consider this cello phrase:
If it doesn’t sound like high-fidelity audio, that’s because I took the original recording of the cello phrase, played it through my phone speakers, and re-recorded the result.
We can hear that the cello is playing a low-ish phrase, reaching a B2 (124 Hz) at the last note. But take a look at the spectrum of this last note:
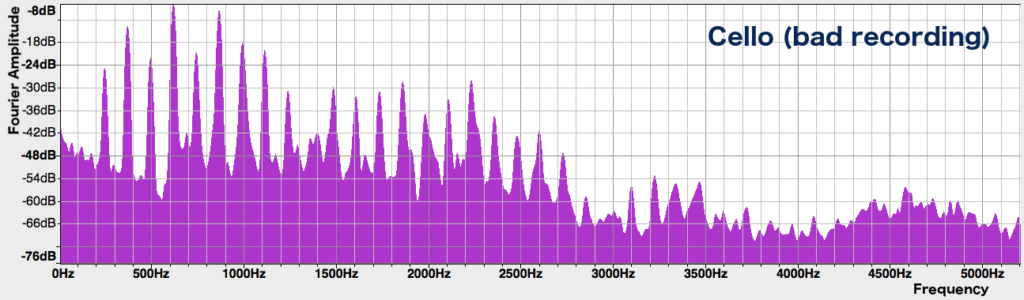
There is no peak at all at 124 Hz! The phone’s speakers are too small to produce such a low frequency. Instead, the first distinct peak is at about 248 Hz. But we know that this is not the fundamental frequency, because if we look at the successive peaks that make up the harmonics, we see that they are spaced 124 Hz apart – they are integer multiples of 124 Hz. This is the spectrum we would expect from a note which has a fundamental frequency of 124 Hz, except that the 124 Hz peak itself is missing. Thus, we hear a note with a pitch that corresponds to 124 Hz – it certainly doesn’t sound an octave higher.
How do our brains figure this out, without looking at the spectrum? It turns out that they take the greatest common divisor of all the frequencies that we hear, to figure out what the fundamental is. Our brains have to do some form of approximation, too, because the harmonics of real instruments are often not exact integer multiples of one frequency. All this is done in real-time as we listen to music! (It’s actually quite difficult to write computer software that can determine the fundamental frequency of a piece of music, in part because of these complications. It’s still an ongoing area of research.)
Here’s the original recording of the cello phrase (before it went through the ordeal of my phone speakers) and the spectrum of the last note:
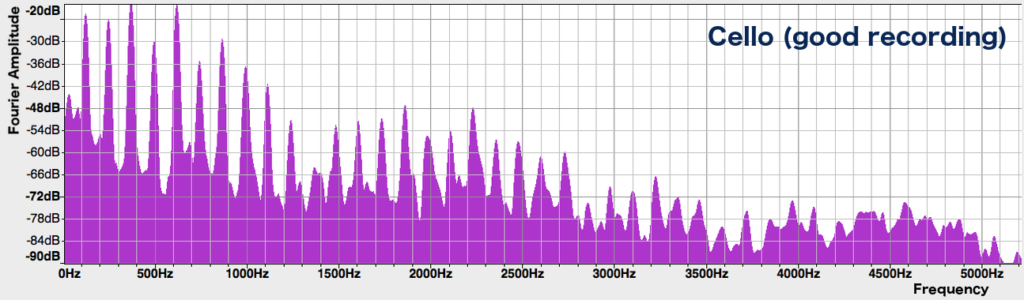
In this version, the 124 Hz peak is present in the spectrum. This makes the sound much fuller and bassier than the phone speaker version – though it is evident that both recordings are playing at the same pitch, in the same octave.
Here’s an even crazier demo. I’ve taken three sine waves, with frequencies of 200 Hz, 400 Hz, and 600 Hz. Here’s what they sound like together:
Not the most pleasant sound, but try to ignore that. Now consider this single sine wave of 700 Hz:
What do you think would happen if I added this 700 Hz sine wave to the mix of the three original sine waves? Let’s try it. Here’s the original mix of three again, just so it’s fresh in your mind:
And here’s what happens when we add in the 700 Hz sine wave:
Isn’t that weird? It now sounds an octave lower! In the original combination of 3 frequencies, we hear a pitch of 200 Hz, but now we hear a pitch corresponding to 100 Hz – even though there’s no 100 Hz wave in there at all. This is because the greatest common divisor of the frequencies is now 100 Hz, rather than 200 Hz as it was before. By adding a higher frequency into the mix, we were able to make it sound lower!
Non-Harmonic Frequencies
We can plot the spectrum of non-pitched sounds as well. For example, here’s the spectrum of a snare drum hit:
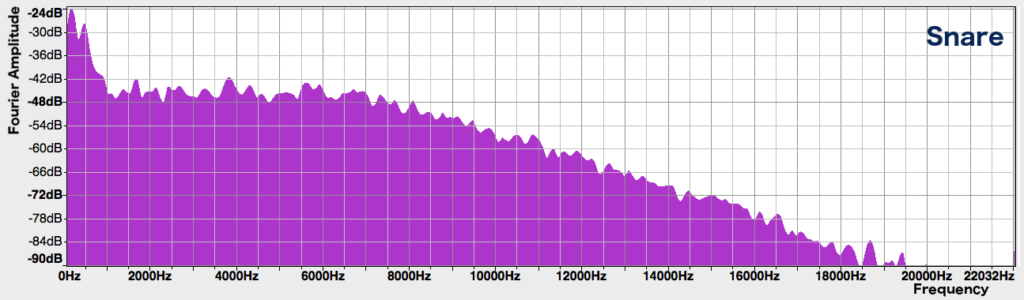
It looks like a mess – you can’t really make out any distinct peaks, and it seems to contain every frequency under the Sun! The spectra of unpitched sounds often contain many frequencies, which are not harmonically related – that is, they are not integer multiples of any particular fundamental frequency. This makes sense – unpitched sounds don’t have periodic waveforms, so you wouldn’t expect there to be a fundamental or harmonics.
Even pitched instrument sounds contain frequencies which are not integer multiples of the note’s fundamental frequency. These non-harmonic components also contribute significantly to tone quality. For example, the scratchy sound of a bow in a violin note, or the raspy or airy quality that some singers’ voices have, are due to non-harmonic parts of their spectra.
As an illustration, consider the following short, aggressive violin note (also playing G5):
Let’s isolate the very beginning of the note, when the bow is digging into the string:
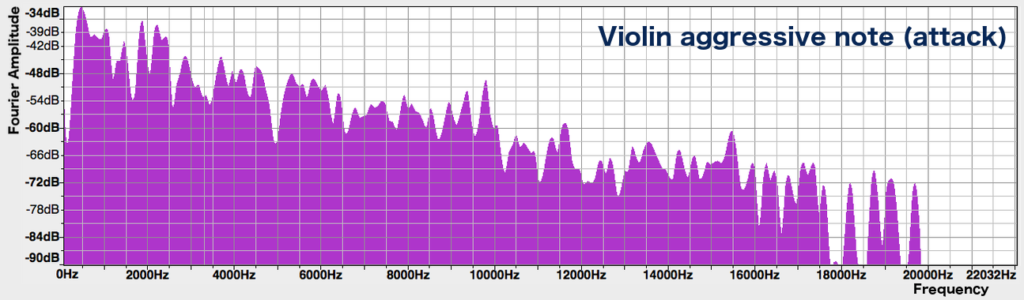
As we can hear, this part of the sound doesn’t have a distinct pitch, and we can’t make out any nice peaks in the spectrum. In the later part of the note, where you can hear a distinct pitch, the spectrum does show distinct peaks:
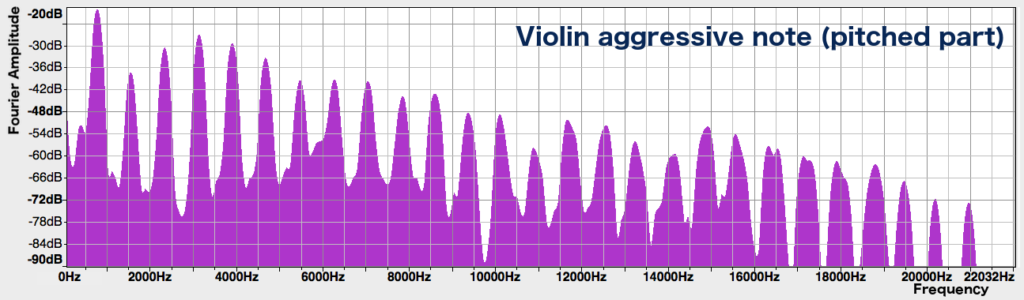
However, these peaks are less defined than those of the legato violin note at the beginning of this post – they seem to melt together into a blob at the bottom. This blob indicates the presence of non-harmonic frequencies, due to the loud bow noise. The louder bow noise of this aggressive note, together with its stronger high harmonics, give it a harsher and more scratchy quality than the smooth violin note that we previously heard.
Changes in the Spectrum
So far, all the spectra we’ve seen have been “snapshots” taken at a particular moment in time during a note. However, the spectrum often changes over the course of a note, and how it changes is another important factor that affects the timbre. In particular, the spectrum right at the onset of a sound can be quite different from that during the sustained part, as we saw in the case of the harsh violin note.
Let’s take a look at how the spectra of various instruments change over the duration of a note. In these spectrograms, the time axis runs from left to right. The horizontal lines mark out the frequencies present, with the colour indicating the strength of the frequency (blue indicates a small amplitude, red a stronger one, and white a really strong one).
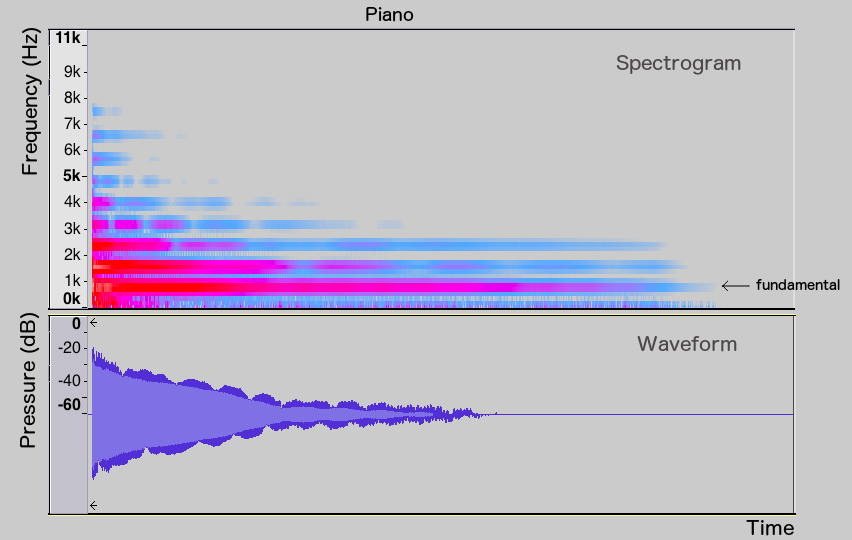
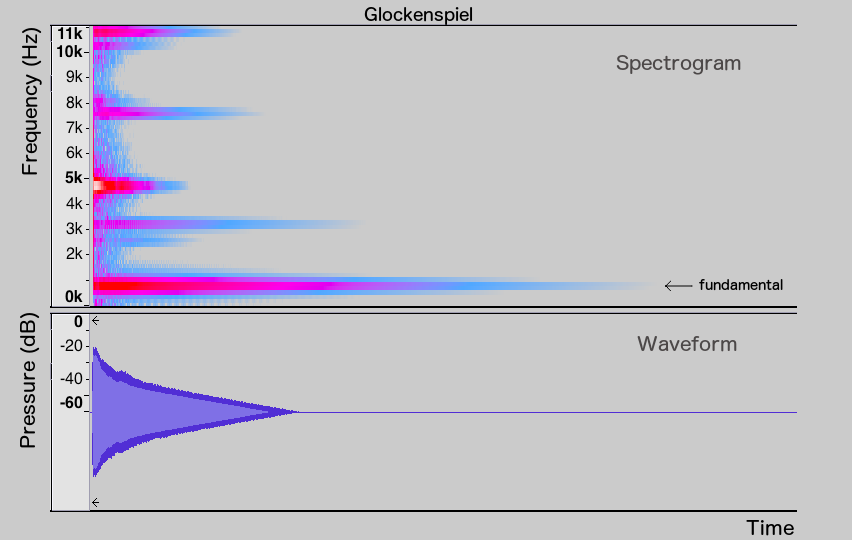
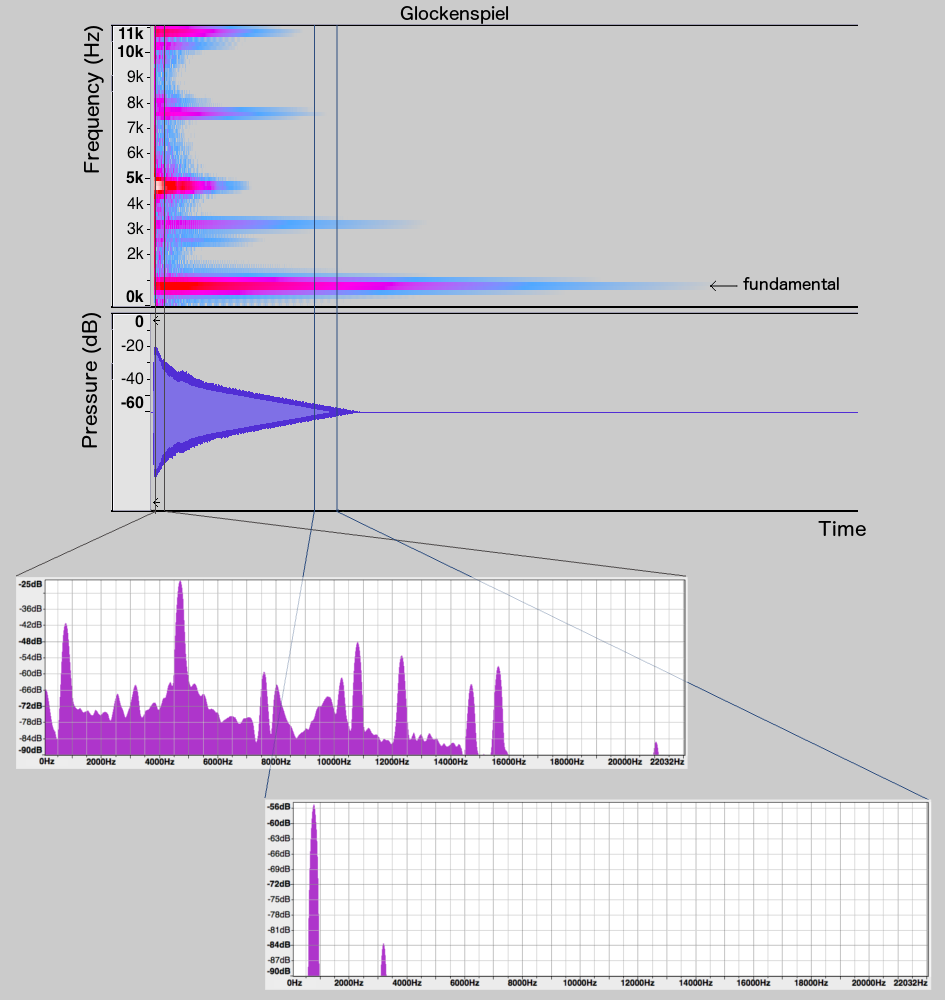
Let’s compare piano and glockenspiel G5 notes. While the piano’s fundamental and harmonics (especially the first three frequencies) are sustained throughout the duration of the note, the harmonics of the glockenspiel die off much more quickly, leaving only the fundamental at the end. The spectrum snapshots of the glockenspiel note at its beginning and end illustrate this phenomenon further:
What about instruments that play sustained notes, such as the flute that we heard at the beginning of the post?
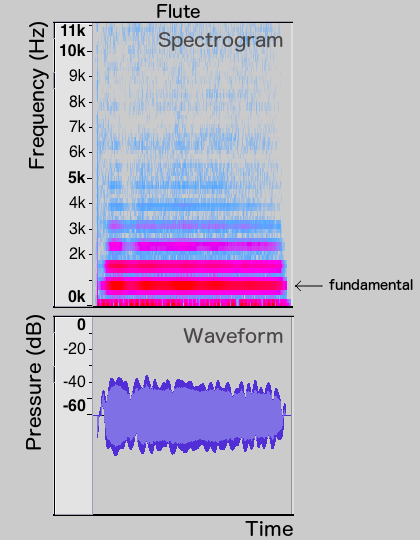
The flute’s spectrum is pretty much constant throughout the note’s duration, as might be expected. At the onset of the note, we do see that the harmonics come in a little later than the fundamental, and at the end they die out a bit sooner.
These spectral changes over the course of a note also contribute to an instrument’s distinctive tone quality.
So far we’ve looked at how the frequency content of a note, as shown in its spectrum, affects its timbre. In the next part of this series, I’ll talk about some other aspects of timbre – in particular, how the note’s amplitude changes over its duration. We’ll also look at how playing technique can affect the tone quality.
Leave a Reply
4 Comments on "What Makes a Musical Sound Part 2 – Tone Quality and Spectra"
Fascinating!
Rill isn’t!
Brilliant
What program do you use to generate the spectra and spectrograms?